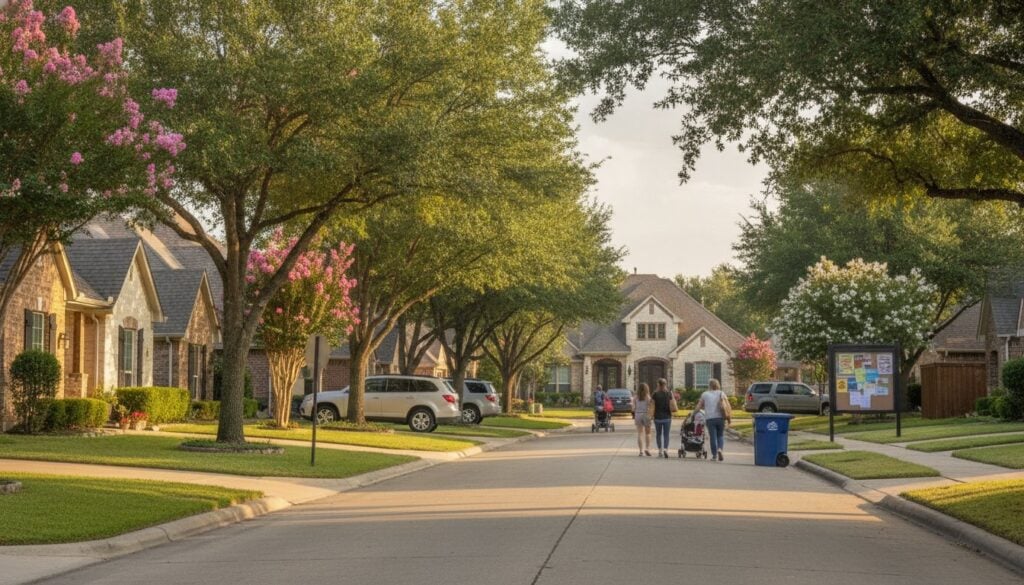
What the Tomball Market Looks Like Right Now
Tomball, Texas is one of the Houston metro’s most consistently active suburban markets, and April 2026 is giving both buyers and sellers plenty to think about. According to KCM Local data pulled as of April 28, 2026, the numbers tell a layered story, one that rewards careful reading over quick conclusions.
At 531 active listings, the Tomball area is carrying a meaningful supply of homes. That is not a flood of inventory, but it is enough to give buyers real options, which is a shift from the inventory-starved conditions many Houston-area markets saw in 2021 and 2022. For sellers, it means pricing and presentation matter more than they did a few years ago.
Active Listings: 531
KCM Local counts 531 active listings in the Tomball market as of late April 2026. So what does that number mean for you? It means buyers are no longer choosing between two or three homes on a weekend. There is actual selection. For sellers, it means your home is competing against hundreds of others, so the days of listing high and waiting are mostly behind you.
Median Listing Price: $409,950
The median listing price sits at $409,950. Think of it as the midpoint of what sellers are asking, not necessarily what buyers are paying. That distinction matters. List prices and sold prices often differ by several thousand dollars in a market with healthy inventory. If you are budgeting as a buyer, factor in some negotiating room. If you are a seller, pricing at or just below the median in your specific neighborhood can generate faster activity than stretching above it.
Median Square Footage: 2,510
The median home being listed in Tomball right now is 2,510 square feet. That is a solidly sized single-family home, which fits the profile of what Tomball buyers typically seek: space for families, home offices, and the kind of layout that suburban Northwest Houston living usually calls for. On a price-per-square-foot basis, $409,950 at 2,510 square feet works out to roughly $163 per square foot, which is a useful benchmark when you are evaluating a specific listing.
New and Pending Listings Tell the Demand Story
Raw active inventory only tells you how many homes are sitting on the market. New listings and pending listings tell you how fast homes are moving in and out. Both numbers from KCM Local’s April 28, 2026 snapshot deserve attention.
New Listings: 168
168 new listings entered the Tomball market around this reporting period. That is a healthy flow of fresh supply. For buyers, it means new options are consistently appearing, so checking listings frequently, ideally with a saved search, keeps you from missing homes before they go pending. You can search current Tomball listings here to stay ahead of new inventory hitting the market.
Pending Listings: 249
Here is the number that should get your attention. With 249 listings under contract, Tomball’s pending count is actually higher than its new listing count. That tells you demand is absorbing supply at a meaningful pace. Sellers who price correctly and present their homes well are finding buyers. The market is not stagnant. It is selective, and that is an important distinction.
What the Ratio Suggests
When you compare 249 pending transactions against 531 active listings, roughly 47 percent of the visible market is under contract at any given moment. That is a signal of real activity, not a slow drift. Translation: this is not a buyer’s market in the traditional sense, and it is not a seller’s market with bidding wars either. It is a balanced-to-slightly-active market where the right home at the right price moves.
ZIP Code Breakdown: How Tomball’s Submarkets Differ
Tomball does not behave as one uniform market. The ZIP codes that cover the broader Tomball area each carry their own supply, price, and velocity profile. The data below comes from local market records for the last 90 days and adds important texture to the KCM headline numbers.
ZIP 77375: High Volume, Compressed Prices
ZIP 77375, which covers portions of the Tomball and Spring boundary area, shows a median sold price of $155,000 over the last 90 days, with 756 active listings, 6.2 months of inventory, and 392 sales in that period. The median sold price here is considerably below the broader Tomball listing median, which likely reflects a mix of property types, lot sales, or lower-priced housing segments pulling the median down. The 6.2 months of inventory puts this submarket in balanced-to-buyer-favorable territory. That said, the volume of sales, 392 in 90 days, is the highest of any Tomball-area ZIP, which means transactions are happening even if price appreciation is moderate.
ZIP 77377: The Mid-Range Sweet Spot
ZIP 77377 carries a median sold price of $334,995, 555 active listings, and 7.3 months of inventory, with 234 sales over the last 90 days. At 7.3 months of supply, buyers in this ZIP have more negotiating position than sellers. That is not a collapse in demand; it is a normalization after years of extreme seller-side conditions. If you are buying in 77377, you have time to be thoughtful. If you are selling, pricing sharp and staging well are the two moves that separate a quick sale from a long wait. You can learn more about selling strategies that work in exactly this kind of market.
ZIP 77447: Newer Construction, Higher Inventory
ZIP 77447 shows a median sold price of $271,300, but the standout number here is 1,233 active listings, with 7.3 months of inventory and 549 sales in 90 days. That active listing count is the highest of the three ZIPs, which likely reflects significant new construction activity in this corridor. Builders listing communities in bulk can inflate the active count without necessarily signaling a distressed or oversupplied resale market. If you are a buyer comparing a new build against a resale in 77447, understand that the competition from builder inventory gives you more options, but builders often have their own incentive structures that resale sellers cannot match dollar-for-dollar.
Mortgage Rates: The Variable Nobody Can Ignore
No housing market update is complete without addressing borrowing costs. As of April 23, 2026, the 30-year fixed mortgage rate according to Freddie Mac’s Primary Mortgage Market Survey stands at 6.23 percent. That matters enormously for Tomball buyers because it sets the floor on monthly payment calculations.
What 6.23 Percent Means at Tomball’s Median Price
At a $409,950 purchase price with a 20 percent down payment, a 30-year fixed loan at 6.23 percent produces a principal and interest payment in the range of $2,010-$2,060 per month, before taxes, insurance, and HOA fees. For many Tomball households, that is a workable payment. For others, it stretches the budget in ways that make programs like down payment assistance worth exploring. The Texas State Affordable Housing Corporation, known as TSAHC, and the Texas Department of Housing and Community Affairs, TDHCA, both offer programs that can meaningfully reduce upfront costs for qualifying buyers.
The Rate Environment Is Not Ideal, but It Is Stable
Rates at 6.23 percent are not the historic lows of 2020 and 2021, but they have been relatively stable compared to the volatility buyers experienced in 2022 and 2023. That stability matters because it makes planning easier. You can model payments with reasonable confidence that the rate you see today is close to what you will lock. Waiting for rates to drop to 5 percent or below before buying in Tomball is a calculated risk, not a guaranteed strategy. Prices could rise, inventory could tighten, and you may end up paying more in total cost even if the rate eventually improves.
First-Time Buyers: Additional Resources Available
If you are a first-time buyer looking at Tomball, the rate environment is one reason to study every available assistance option before you make an offer. Programs backed by TSAHC and TDHCA have income and purchase price limits that many Tomball homes fall within, particularly in the lower and mid-range ZIPs. You are not alone in finding the math challenging right now. Thousands of first-time buyers in the Houston metro successfully close on homes every year with help from these programs. You can review a broader set of options on the first-time home buyer tips page to see what might apply to your situation.
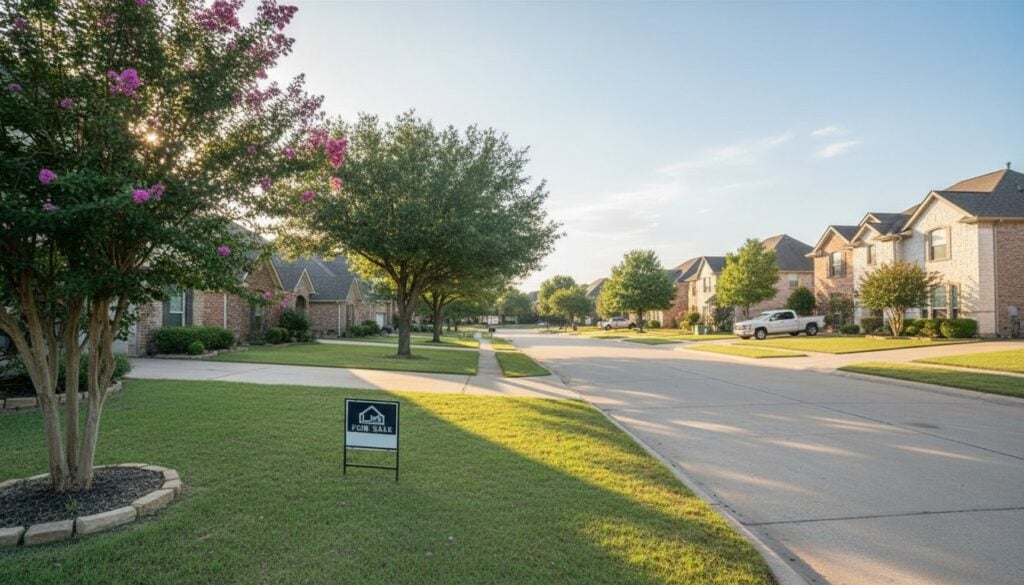
Seller Considerations in April 2026
If you own a home in Tomball and are thinking about selling this spring or summer, the data above gives you a clear picture of what you are stepping into. This is not a market where overpricing and hoping works. It is one where positioning wins.
Pricing to the Market, Not to Your Wish List
With 531 active listings competing for buyer attention, your list price is the first filter most buyers apply. Homes priced above comparable recent sales are being skipped in online searches before the first photo loads. The Texas A&M Real Estate Research Center consistently shows that homes priced within 2-3 percent of market value sell faster and closer to asking price than those that start high and reduce. Starting right is almost always better than chasing the market down with price cuts.
Condition Drives Speed
Buyers in Tomball right now have enough choices that they can afford to be selective. Deferred maintenance, dated kitchens, or poor curb appeal are not dealbreakers in a tight market, but this is not a tight market in most Tomball ZIPs. Bright homes with updated kitchens and clean mechanicals move faster. That is exactly why pre-listing condition assessments are worth the time. Knowing what a buyer’s inspector will flag lets you fix it, price around it, or disclose it upfront, all of which are better than a surprise that kills a deal in the option period.
Seller Alternatives Worth Knowing
If your timeline is compressed, or if putting a home on the market and managing showings does not fit your situation, a cash offer is worth understanding. Cash buyers close faster, skip the appraisal contingency, and are not dependent on a buyer’s mortgage approval. The tradeoff is that cash offers typically come in below full retail value. Whether that tradeoff makes sense depends entirely on your priorities. You can get a cash offer estimate to see what that option looks like for your Tomball home without any obligation to proceed.
Buyer Considerations in April 2026
Tomball buyers in April 2026 are in a more favorable position than buyers were two or three years ago. More inventory, more time to decide, and a market where negotiation is possible again. That said, the best homes still move. Hesitating too long on a well-priced home in a desirable Tomball neighborhood remains a way to miss out.
Get Pre-Approved Before You Search
At a 6.23 percent rate, knowing your exact purchasing power before you tour homes is not optional, it is the baseline. Sellers in Tomball are unlikely to accept offers without pre-approval letters, and in the sub-markets where activity is brisk, a 24-48 hour delay while you get your financing in order can cost you the house. Work with a lender who can turn a pre-approval in 24 hours or less.
Understand Which ZIP You Are Buying In
The three Tomball-area ZIPs covered in this report each carry different inventory levels and different negotiating dynamics. Buying in 77377 or 77447, where inventory sits at 7.3 months, gives you more time and more leverage than buying in 77375 at 6.2 months. Those differences are real, and your offer strategy should reflect them. A flat offer with no concession requests makes sense in a tighter submarket. Asking for seller-paid closing costs or a price reduction is more defensible in a submarket with higher supply.
Consider the Full Cost Picture
At Tomball’s median listing price, your monthly housing cost includes more than principal and interest. Property taxes in Harris County typically run 2.0-2.5 percent of assessed value per year, which adds $680-$855 per month on a $409,950 home. Add homeowner’s insurance, HOA dues where applicable, and maintenance reserves, and the real monthly cost of homeownership in Tomball is comfortably above the mortgage payment alone. Budget for the full picture, not just the note.
Community Context: Tomball in Spring 2026
Market data always reads differently when you know the community behind it. Tomball’s appeal is not complicated: it is a city with a genuine small-town identity, proximity to the Energy Corridor and Northwest Houston employment centers, and a school district that consistently draws families relocating into the area. That combination keeps demand steady even when broader market conditions soften.
Local Business Activity as a Market Signal
Community Impact reported in April 2026 that Bake Me Happy in Tomball rebranded to Cafe Ninda as of March 31. A small detail, but it reflects something meaningful: Tomball’s small business environment is active and evolving, not contracting. Thriving local business scenes correlate with stable or rising residential demand over time. People want to live where neighborhoods feel alive, and Tomball’s downtown and surrounding corridors continue to show that kind of energy.
What Draws Buyers to Tomball Specifically
Buyers comparing Tomball against Cypress, Spring, or The Woodlands often cite three things: relative affordability within the Northwest Houston corridor, the charm of a historic downtown, and newer master-planned communities that offer modern amenities. Tomball is not trying to be The Woodlands, and that distinction works in its favor. It has its own identity, and the housing market reflects a buyer profile that values authenticity alongside convenience.
What to Watch Over the Next 90 Days
April data gives you a snapshot. The next 90 days, May through July, will add important layers to the Tomball story for 2026. Here is what to track.
Pending-to-Close Conversion Rate
249 pending listings is a strong number, but pending does not always mean closed. If contract failures start rising, it is usually a sign that appraisals are coming in low relative to list prices, or that buyers are backing out during the option period after inspection discoveries. Watch for shifts in the active-to-pending ratio in the coming months. If pending counts drop relative to actives, the market is softening. If they hold or grow, demand is real and sustained.
New Construction Activity in 77447
The 1,233 active listings in ZIP 77447 bear watching. If builder starts slow in that corridor, the active count will drift lower and supply pressure on resale homes will ease. If builders continue adding inventory, resale sellers in 77447 will need to compete more aggressively on price and condition. The Texas A&M Real Estate Research Center publishes monthly permit data that can give you early signals on this front.
Rate Sensitivity Among Buyers
If the Freddie Mac 30-year rate moves meaningfully from the current 6.23 percent, expect buyer activity in Tomball to respond. A drop toward 5.75-6.00 percent would likely pull sidelined buyers off the fence and compress the available-to-pending ratio. A rise toward 6.75-7.00 percent would cool activity further. Monitoring the weekly Freddie Mac Primary Mortgage Market Survey is a straightforward way to stay informed. You can also schedule a call to get a read on how rate shifts are affecting what buyers in your price range are actually doing.
Putting It All Together for Tomball
The Tomball housing market in April 2026 is functioning. It is not euphoric, and it is not distressed. With 531 active listings, a median price of $409,950, and 249 pending contracts, it is a market where prepared participants on both sides can accomplish their goals. The inventory levels across the three primary ZIP codes give buyers real choices and sellers real competition. Mortgage rates at 6.23 percent are a real cost factor, but programs from TSAHC and TDHCA exist to help qualified buyers manage that cost. If you want to dig into what your specific home might sell for, or what a home you are eyeing is actually worth, the data is here and the path forward is clear. Pick the path that moves you forward with the least risk and the most clarity, whether that means listing, buying, or simply learning more before you decide. You can start by understanding how the offer process works so there are no surprises when you are ready to act.